Science Project –Selmaware Plotting and Basic Stamps
By Brian Lincoln
My 8 year old daughter decided to find out how the color of roofs affect the temperature inside of a house as her 3rd grade science project and I thought what a perfect application of Selmaware’s plotting routines married to the Basic Stamp. She would design, build, and perform the science experiment while I provided the instrumentation and telemetry. The final presentation is shown in Figure 1 with an example of the model house she built in the foreground. I still remember my wife saying…. “Dad…hands off!”.

Figure 1. My 8 year old daughter Juliana with her final presentation
I had read an article in Nuts and Volts by Jon Williams on interfacing the Dallas 1620 temperature sensor with the BS2. I also remember he reviewed the SelmaWare product called StampPlot Pro. I expanded both applications into a 6 temperature sensor data logging and plotting telemetry system using the BS2 and 6 Dallas Semiconductor 1620 sensors. The requirements for my daughter’s experiment were that she had to log the data with pen and paper manually. Using StampPlot Pro’s large gauges and logging capability that stored raw data for post plotting did the trick. The experiment took over 8 hours to perform. It took about 2 weeks to build and perform the experiment including the electronics that I built.
The System Design
The overall telemetry system design concept is to collect temperature data on model homes made from cardboard shipping boxes with different color roofs and relay it back to a host computer for display and logging. Also, the outside ambient temperature has to be measured. The BS2 was used as an intermediate processor placed next to the model homes, reducing the harness length to each of the 6 temperature sensors as shown in Figure 2. The BS2 provides the immediate interface to the DS1620 (clocking and requests for data) and then performs the conversion to degrees F. It then sends the data over a 50 foot RS232 cable to the host laptop computer where it is plotted and logged on StampPlot Pro. The BS2 operates on a 9 volt battery and is located remotely at the site of the model houses on a table while the laptop is located inside our home in the comfort of our den. The experiment had to run all day (over 8 hours) and the weather could be unpredictable, so I thought it best to set up command central inside the house.

Figure 2. Multiple Sensor System Block Diagram
My daughter decided she wanted to use large analog graphic gauges after reviewing all of the default setups provided by StampPlot. This would give her both immediate graphical comparisons of the different temperatures as well as display the results numerically. StampPlot Pro would log the data in the background for later post processing and as a backup. The large gauges made it easy to see trends throughout the day and still give her an easy way to read the data for logging on her data sheet. It was very convenient to glance over to her laptop and see the immediate relationship of each house’s temperature from way across the room due to the colorful analog gauges.
The Hardware
The Basic Stamp products make prototyping extremely easy using a carrier board, 9 volt battery and a small protoboard. I chose the BS2 because I am the most familiar with it through my experimentation with robots. It is versatile, fast, and my standard prototyping microcontroller for other projects. The 9 volt battery made it easy to place the table of houses anywhere in the backyard without worrying about running an AC power line to the experiment.
The 6 sensors were connected through the BS2 utilizing pins 0 through 7 with minimal support parts as shown in Figure 3’s schematic. Pins 0 through 5 were the chip select (RST) for each of the six DS1620 sensors. Data (DQ) is retrieved on Pin 7 while Pin provides the common clock. Power and ground was also passed through the harness to the sensors.

Figure 3. Schematic of multiple DS1620 Temperature sensors attached to BS2
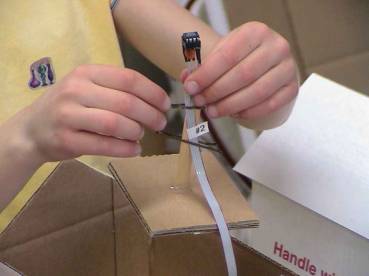
The DS1620 chips were attached to the BS2 through 30 inch harness made from ribbon cable (Figure 4) then clipped onto small standoffs made from Popsicle sticks. I used 0.1 uF capacitors at each remote DS1620 to reduce noise.
Data was passed through one pin (Pin 7) to all sensors with a 1K resistor in series on the DQ lines to protect the DS1620s and the BS2 in case the input/outputs were mistakenly switched. I added the 10 K resistor to VDD on the DQ common point to help eliminate noise on the 30 inch ribbon cable harnesses. Having 6 sensors hanging out on the harnesses through 1 K resistors was causing erroneous results. The mini network needed to be tied to one supply side.
The harnesses were attached to the protoboard next to the BS2 and routed to each of the model houses as shown in Figure 5.

Figure 4. DS1620 Temperature sensor on ribbon cable harness attached to Popsicle stick standoff


Figure 5. Left: Houses being setup and sensors
installed (Harnesses through front doors)
Right: BS2 and protoboard with Outside temperature sensor on left side
The BS2 Software
Starting with Jon Williams DS1620 code from Nuts and Volts July 2001 issue, I expanded the initialization and main routines to include the 6 sensors. The program SCIENCEPROJ.BS2 is shown in the attached listing. I chose to leave each temperature sensor routine separate, rather than ganging them into a FOR NEXT loop as noted in Listing 1. Often I will do this in my coding to keep the code readable and easy to modify quickly. Having worked years in aerospace and I always value readability over finesse when in the development stages of a project.
I commented out some of the DS1620 initialization code since I didn’t need to keep re-burning the configuration into the EEPROM.
I decided to reduce the temperature resolution to whole degrees at the last minute and therefore even though the subroutine goes to the trouble of calculating fractional degrees, I re-converted the values in the debug statement. Thank goodness for lots of processing margin.
The Plotting Application – StampPlot Pro
Selmaware StampPlot Pro is an outstanding package that allows the user to collect data and display it in a variety of options, real-time. The data logging feature collects data in a “.TXT” file that can be post processed later in other data bases.
Macros are the key to creating your own gauges and graphs. I chose to take the default analog gauge, duplicate it and move things around to show 6 independent temperature readings. I also modified the numerical readout to show the current reading as well as the Min/Max for the day. Figure 6 shows a close up of the display my daughter settled on that is contained in the Macro file JJTemp6I.spm. The StampPlot Pro application is pretty self intuitive.

Figure 6. StampPlot Pro on Laptop with 6 large analog gauges
Martin Hebel from SelmaWare really supports his product and was quick to answer any questions I had on StampPlot Pro. I needed advice several times and was very impressed with the response time, which was usually in just a few hours.
On the day of the experiment, I had moved the hardware set up from an NX-1000 prototype board to the small battery operated carrier board. When powered up the data would not log due to the carrier board ATN line not being capacitively coupled. I quickly emailed Martin with an explanation of the problem and he responded with a very quick solution of turning off that signal line in the StampPlot Pro application. It saved me form having to cut and solder a capacitor on the carrier board at the last minute.
Following the experiment, I reviewed the automatically logged data in the “.txt” file. I converted to a database program and manipulated the data easily due to the comma delimiters. The Selmaware package does it all. See the results of the experiment.
Day of the Experiment
The experiment was set up on a table with the BS2 located within 3 feet of all the houses. We covered the BS2 and outside temperature sensor to avoid sun loading. Figure 7 shows the RS232 cable leaving the table and running into our home. My daughter started the experiment before sunrise and it ran all day (over 8 hours).

Figure 7. Day of Experiment: Model houses lined up outside with BS2 under the shade
cover.
RS232 cable (50’) connects Stamp to Laptop located inside our home
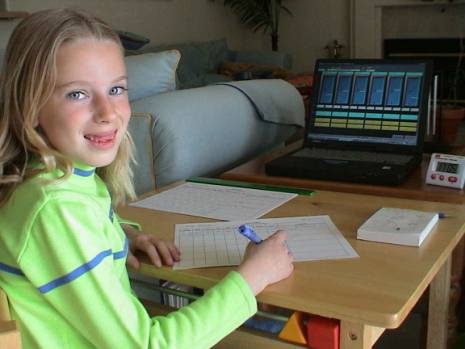
Inside our family room was command central. My daughter would log the data from the laptop shown in Figure 8. She was required to write down the data manually. The large analog gauges (StampPlot Pro) made this an easy task with numerical readouts.
She then plotted the data on graph by hand (required) and analyzed the curves. The results showed that the darker color roofs were hotter than the lighter color roofs. Rain clouds cut the experiment a bit short, but plenty of data was gathered. I was amazed to find out that the white roofs were 20 degress F cooler than the black roof during mid day readings.

Figure 8. My daughter logging data from StampPlot Pro analog gauges at Mission Control
Summary
My daughter received an A+ on her project and she learned a lot about heat transfer, which of course was the purpose of the experiment in the first place. Being able to quickly prototype up the BS2 and temperature sensors was critical to the success of this simplistic telemetry system. Plotting and displaying the data real-time with StampPlot Pro rivals many of the professional systems that I use at work. All in all, both my daughter and I learned quite a bit. She now wants to set up the experiment with REAL houses and REAL roofs. Looks like I will be up in the attic pretty soon.
StampPlot Macro: JJtemp6I.spm
BS2 Source Code: SCIENCEPROJ.bs2